Mimico One Bedroom Condos: What Happened in the First Half of 2026
Dave Dubbin July 14, 2026
Dave Dubbin July 14, 2026
If you own a one bedroom condo in Mimico, or you are thinking about buying or renting one, this report is for you. We pulled every one bedroom with parking that sold or leased through MLS between January 1 and June 30, 2026. That came to 116 sales and 469 leases, most of them in the towers along Lake Shore, Marine Parade, Annie Craig, and Park Lawn. Here is what the numbers say.
Sales: 116 sold. Average price $530,653 (median $529,000). Average $808 per square foot ($822 in Q1, $796 in Q2). Median 25 days on market, average 39.
Watching the Mimico condo market? See every one bedroom currently listed.
Leases: 469 leased. Average rent $2,420 a month (median $2,400). Average $4.02 per square foot. Median 15 days on market, average 22.
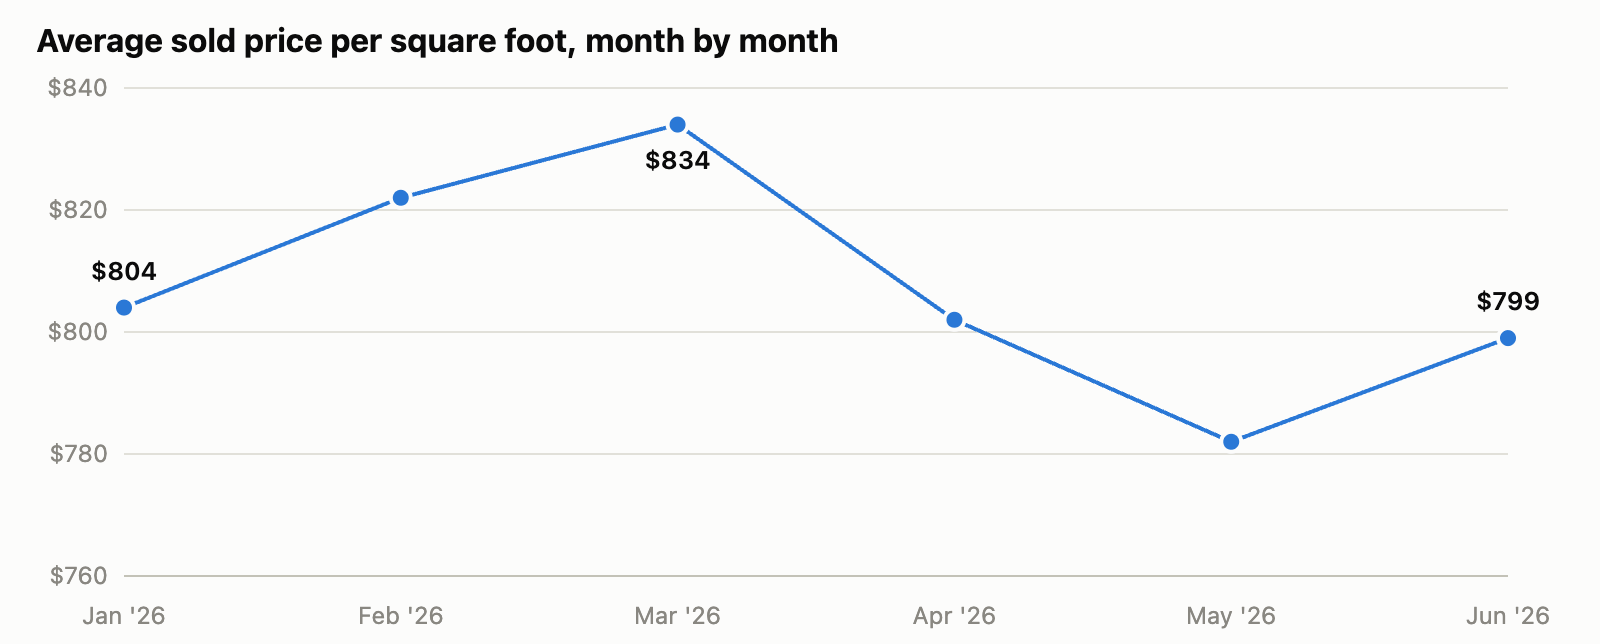
Sale prices drifted down a little. Rents firmed up a little. The average price per square foot on the sales side slipped from $822 in the first quarter to $796 in the second, a drop of about 3 percent. Over the same stretch, average rent went the other way, from $2,400 a month in Q1 to $2,437 in Q2. Renters moved fast and mostly paid full asking. Buyers took their time and mostly paid under it.
And the volume gap is worth sitting with for a second. For every one bedroom that sold in Mimico this half, four leased. That is the reality of the condo market right now. The tenant pool is deep, and a lot of owners are choosing to rent their units out rather than list them for sale.
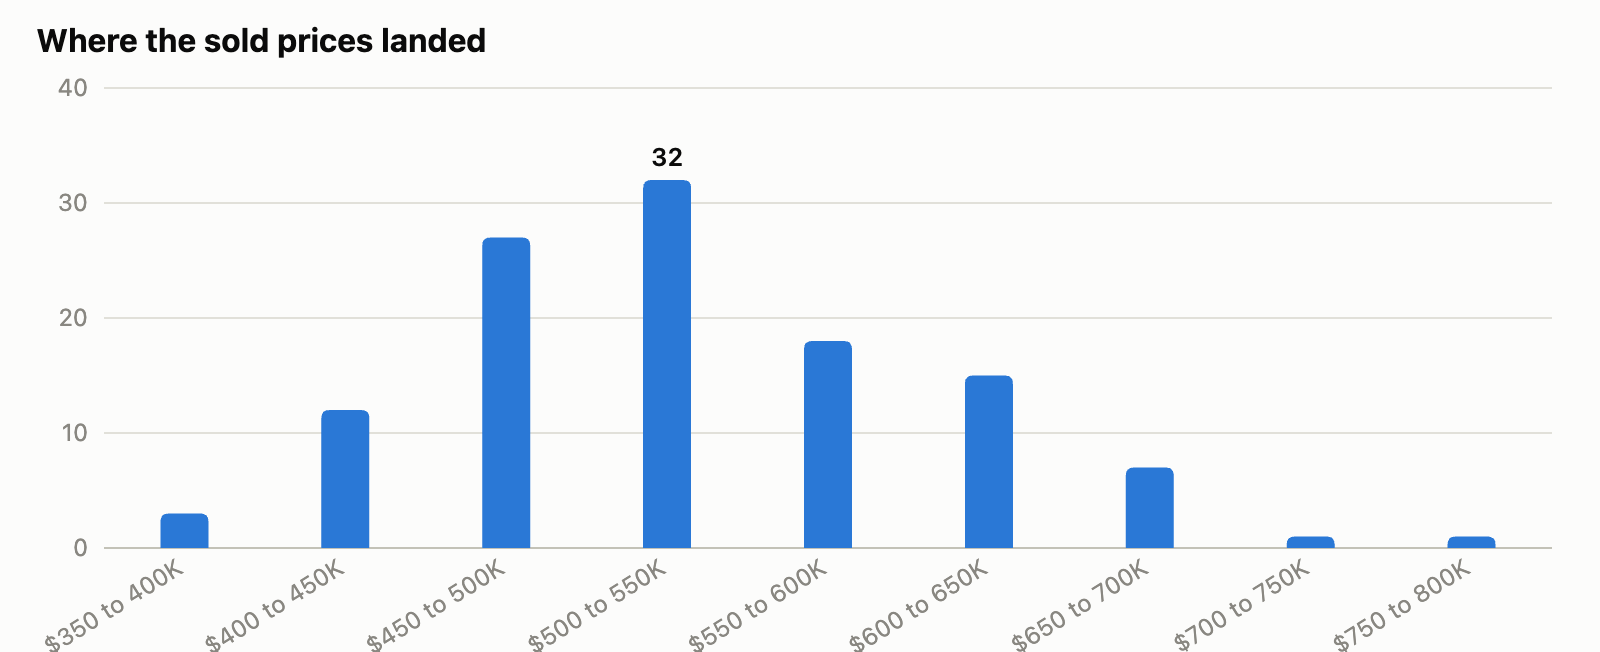
The 116 sales ranged from $360,000 for a suite on Marine Parade Drive up to $775,000 for a large one bedroom at 2267 Lake Shore Blvd W. Most of the action sat in the middle: more than half of all sales closed between $450,000 and $600,000. The typical unit was around 650 to 700 square feet with one parking spot, and the average maintenance fee across all sales was $677 a month.
On pricing, buyers held the pen. Of the 116 sales, 98 closed below the asking price, 4 right at it, and only 14 above. The average sale went for 97 percent of list. That is not a crash, but it is a market where a well priced listing gets respect and an ambitious one sits.
You can see the slide in the line above. Price per square foot peaked in March at $834, then stepped down through the spring and landed at $799 in June. February and March were the strongest months to be a seller this half. June was the friendliest month to be a buyer, with the average sold price dipping to about $513,000.
While buyers negotiated, renters competed. The 469 leases ranged from $1,850 for a suite on Superior Avenue to $4,400 for a large unit on Marine Parade. The average landed at $2,420 a month, and the median tenant paid exactly what the landlord asked. In fact, 273 of the 469 leases went for asking price on the nose, and another 51 went over it.
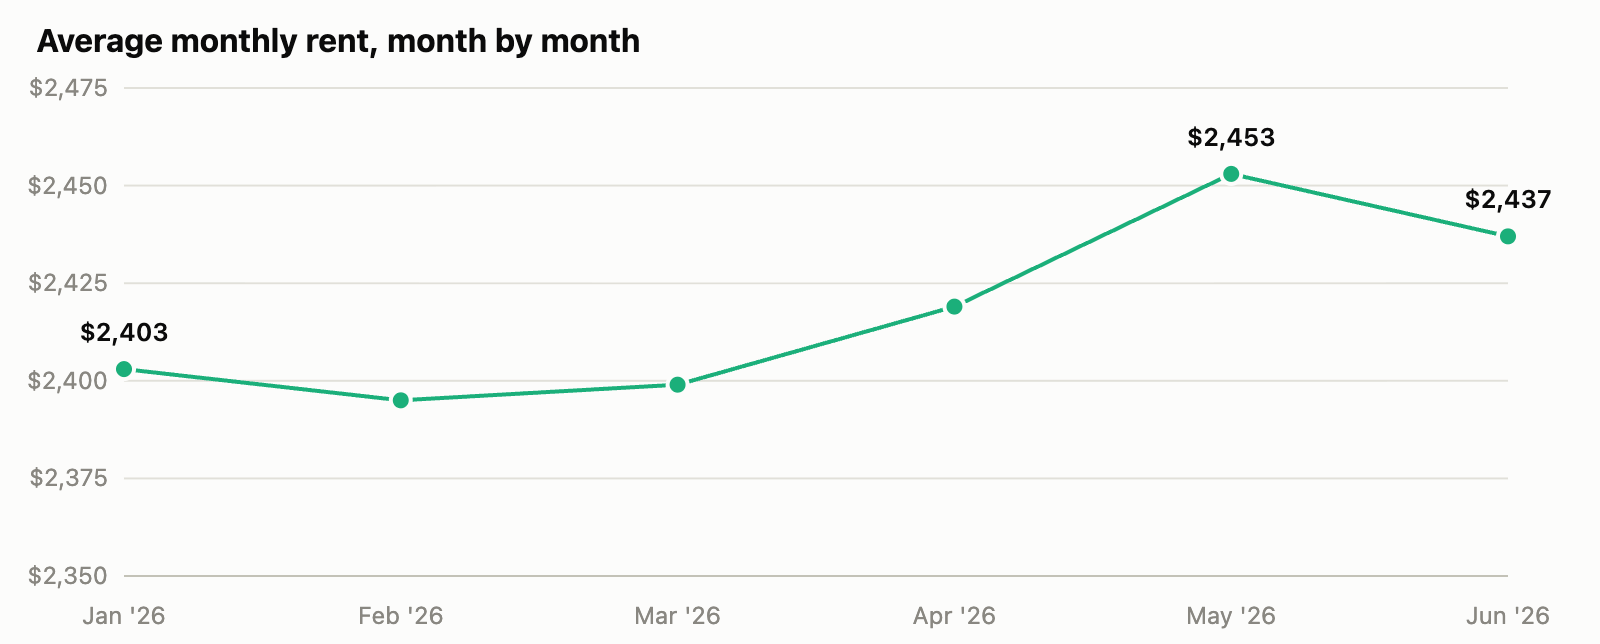
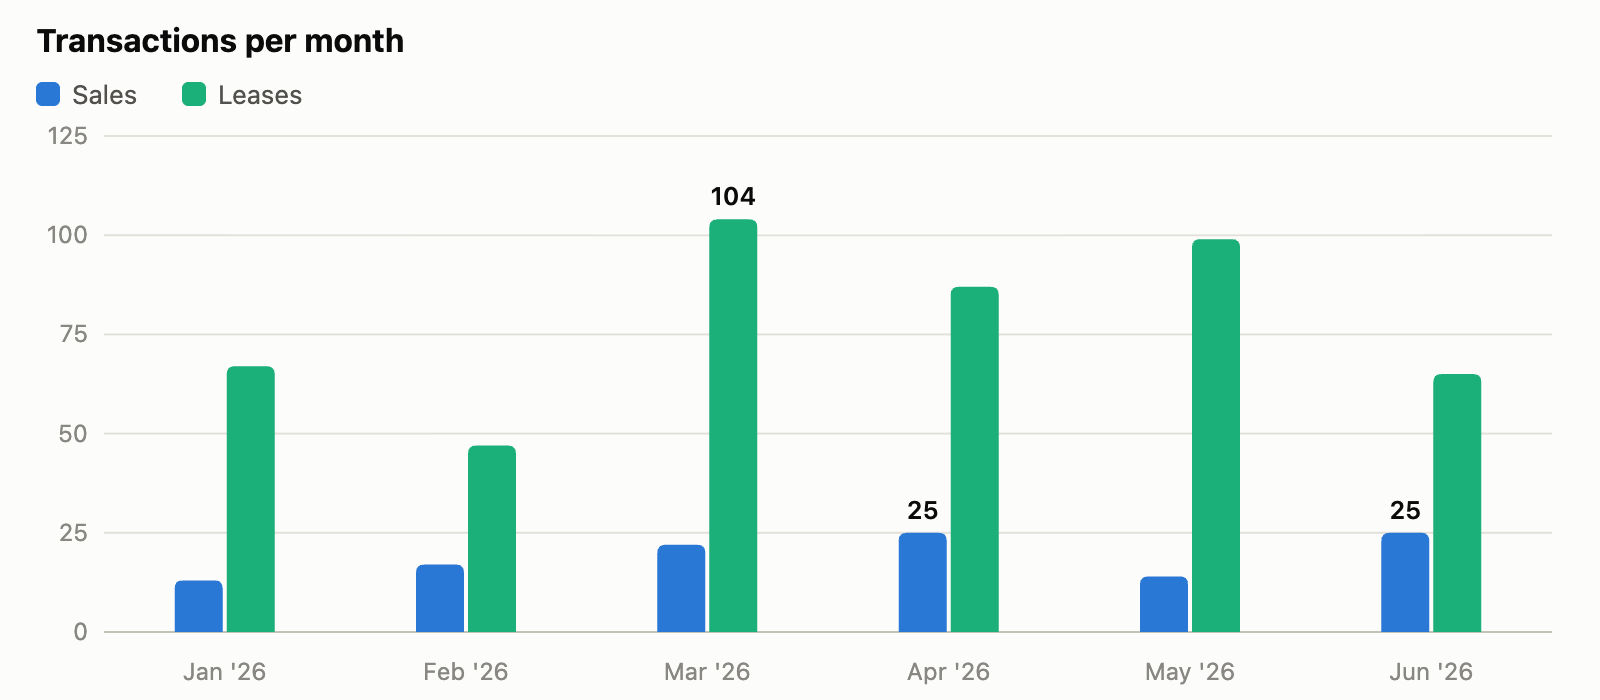
Rents were basically flat through the winter, then picked up as the spring market arrived. May was the busiest single stretch, with 99 leases and the average hitting $2,453. If you are a landlord in Humber Bay Shores, the first half of 2026 treated you well. If you are a tenant, you already know: good units with parking do not sit around.
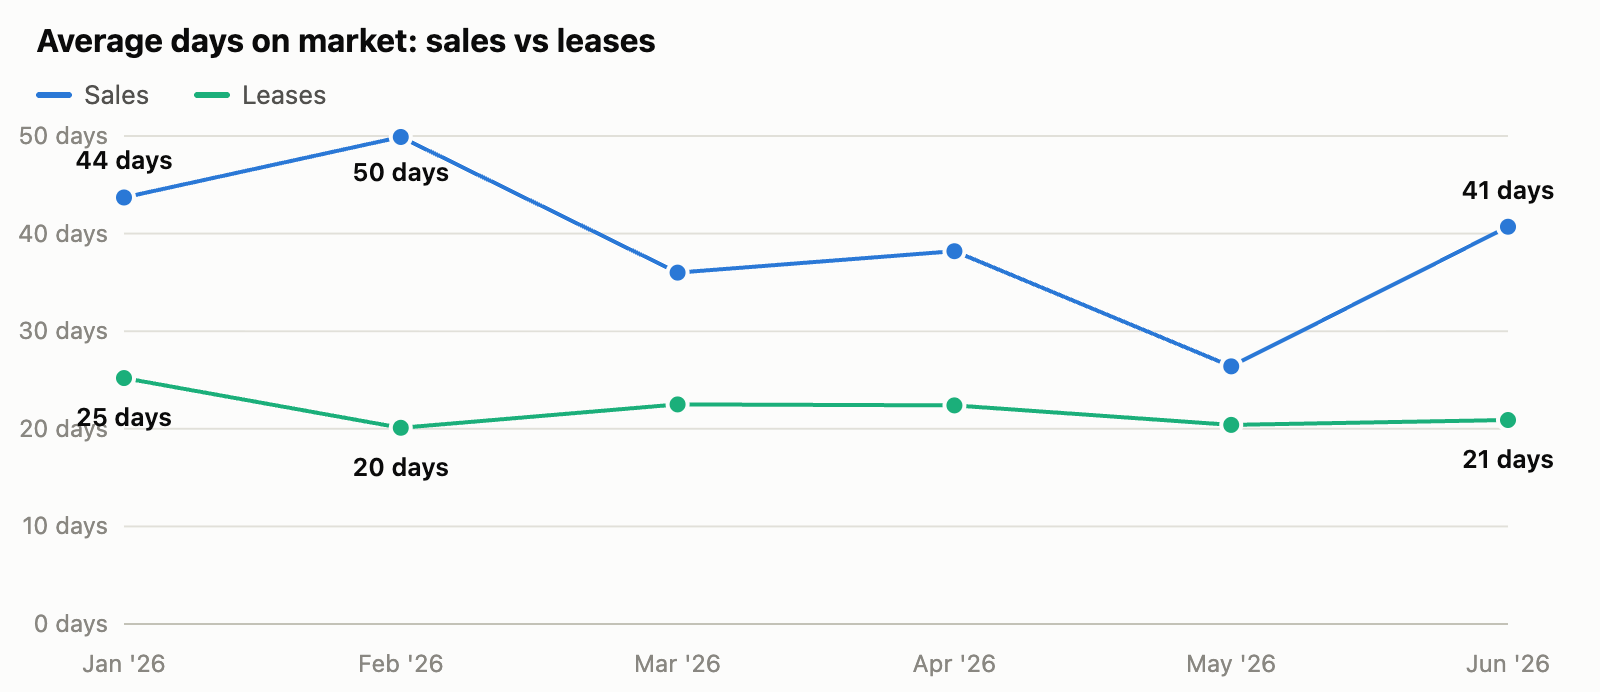
Days on market tells the story better than anything else. The median lease took 15 days. The median sale took 25, and the average sale took 39 because a chunk of overpriced listings sat for two months or more before either adjusting or selling. Nearly half of all leases were done inside two weeks.
Two things stand out in that chart. Sales DOM improved as the spring market warmed up, dropping from nearly 50 days in February to 26 in May. And the lease line barely moved. Demand for rentals in this pocket is steady in a way the sales side just is not right now.
March was the biggest month overall, driven almost entirely by rentals. The busiest addresses will not surprise anyone who knows the neighbourhood: 30 Shore Breeze Drive led the way with 41 transactions, followed by 38 Annie Craig, 70 Annie Craig, 251 Manitoba Street, and 20 Shore Breeze. The towers at Park Lawn and Lake Shore round out the list.
Weighing Mimico against other options? These three will help.
If you are buying, this is the most negotiable this market has been in a while. Prices per square foot are off their March peak, most sellers are accepting offers below asking, and June gave buyers the best average entry price of the half. Units with parking still hold their value better than those without, which is exactly why we cut the data this way.
If you are selling, pricing is everything. The units that sold near asking were the ones priced to the last 90 days of comparable sales, not to what a neighbour got in 2022. The average sale at 97 percent of list hides a wide range, and the listings that chased the market down paid for it in time and money.
If you are an investor, the math is getting interesting. The average one bedroom with parking sold for about $531,000 and the average one leased for $2,420 a month. That is roughly $29,000 a year in gross rent, or a gross yield in the neighbourhood of 5.5 percent before fees and taxes. With rents firming while prices soften, that number has been quietly improving all year.
A question we get all the time, usually over coffee: should I keep renting or just buy the thing? The first half of 2026 gives us clean numbers to work with, so let's run them. Say you buy the average one bedroom with parking at $530,653 with 10 percent down, a 4 percent five year fixed rate, and a 25 year amortization. Your down payment is $53,065. Because you are under 20 percent down, mortgage insurance of $14,805 gets rolled into the loan, so you start with a $492,393 mortgage and a payment of $2,590 a month.
Add the average maintenance fee of $677 and property taxes of about $207 a month and owning runs you roughly $3,474 a month, about $1,054 more than the average rent of $2,420. Case closed for renting? Not quite. About $960 of that first mortgage payment goes straight to paying down your own loan, and that share grows every single month. That part is money you keep, not money you spend.
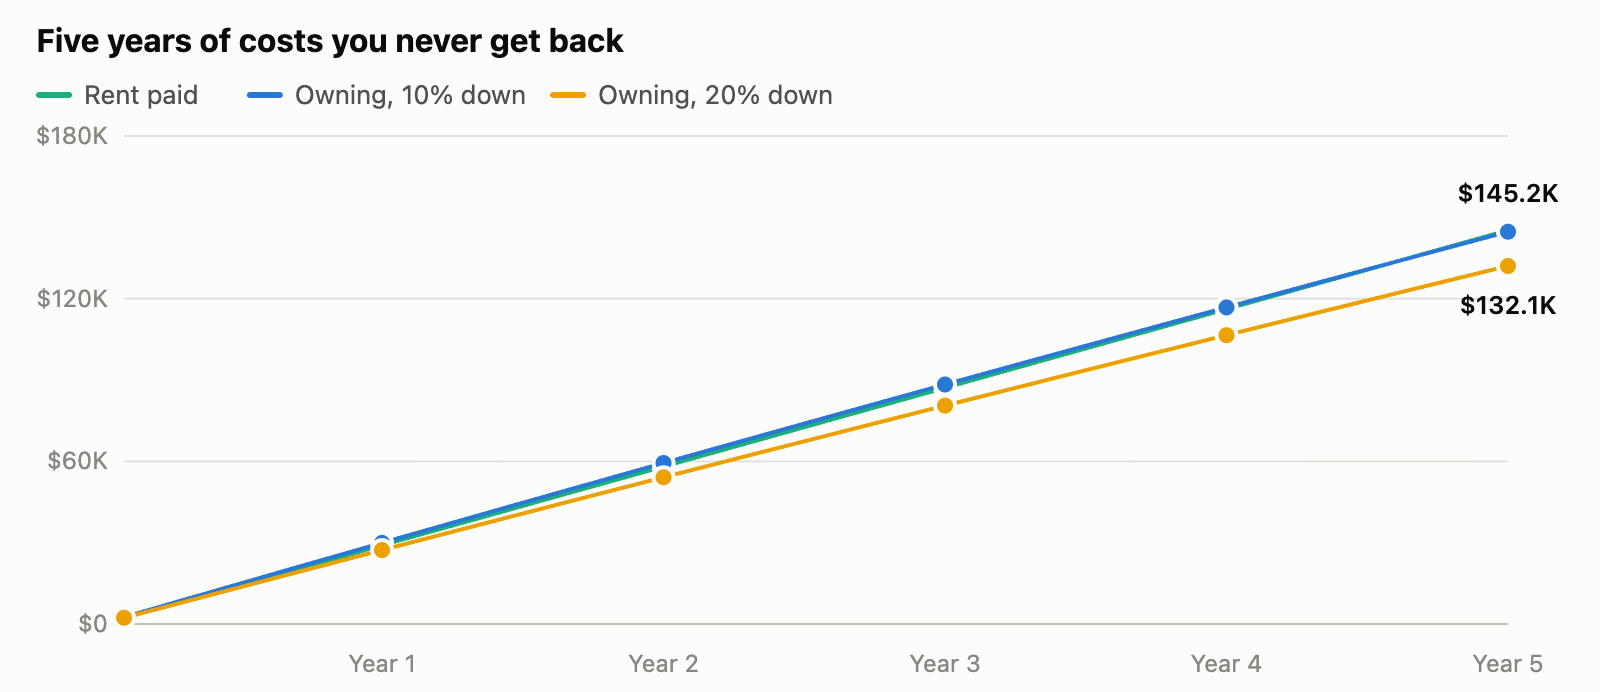
The fair comparison is rent against the money an owner never gets back: interest, maintenance, and property taxes. Over the full five year term that adds up to $144,690. The renter pays $145,200 over the same five years, and that assumes rent never goes up once, which this spring's numbers suggest is generous. On pure cost it is basically a coin flip. The difference is what you are holding at the end. The renter has whatever they saved. The owner has knocked $63,746 off the mortgage and owns whatever the unit itself has done in the meantime.
Now give the buyer 20 percent down instead. The $106,131 down payment stings more up front, but it skips mortgage insurance entirely and the mortgage starts at $424,522, with a payment of $2,233 a month. All in, owning now runs about $3,117 a month, and the five year picture flips. The owner's unrecoverable costs come to roughly $132,055 against the renter's $145,200. That makes owning about $13,145 cheaper over the term, with the mortgage $54,959 lighter at the end and the full down payment still sitting in the unit. At 20 percent down this stops being a coin flip. The bigger cheque wins.
End of year | Rent paid | Owner costs, 10% down | Owner costs, 20% down | Paid down, 10% | Paid down, 20% |
|---|---|---|---|---|---|
Year 1 | $29,040 | $29,927 | $27,264 | $11,760 | $10,139 |
Year 2 | $58,080 | $59,379 | $54,118 | $23,995 | $20,687 |
Year 3 | $87,120 | $88,337 | $80,547 | $36,724 | $31,662 |
Year 4 | $116,160 | $116,781 | $106,532 | $49,967 | $43,080 |
Year 5 | $145,200 | $144,690 | $132,055 | $63,746 | $54,959 |
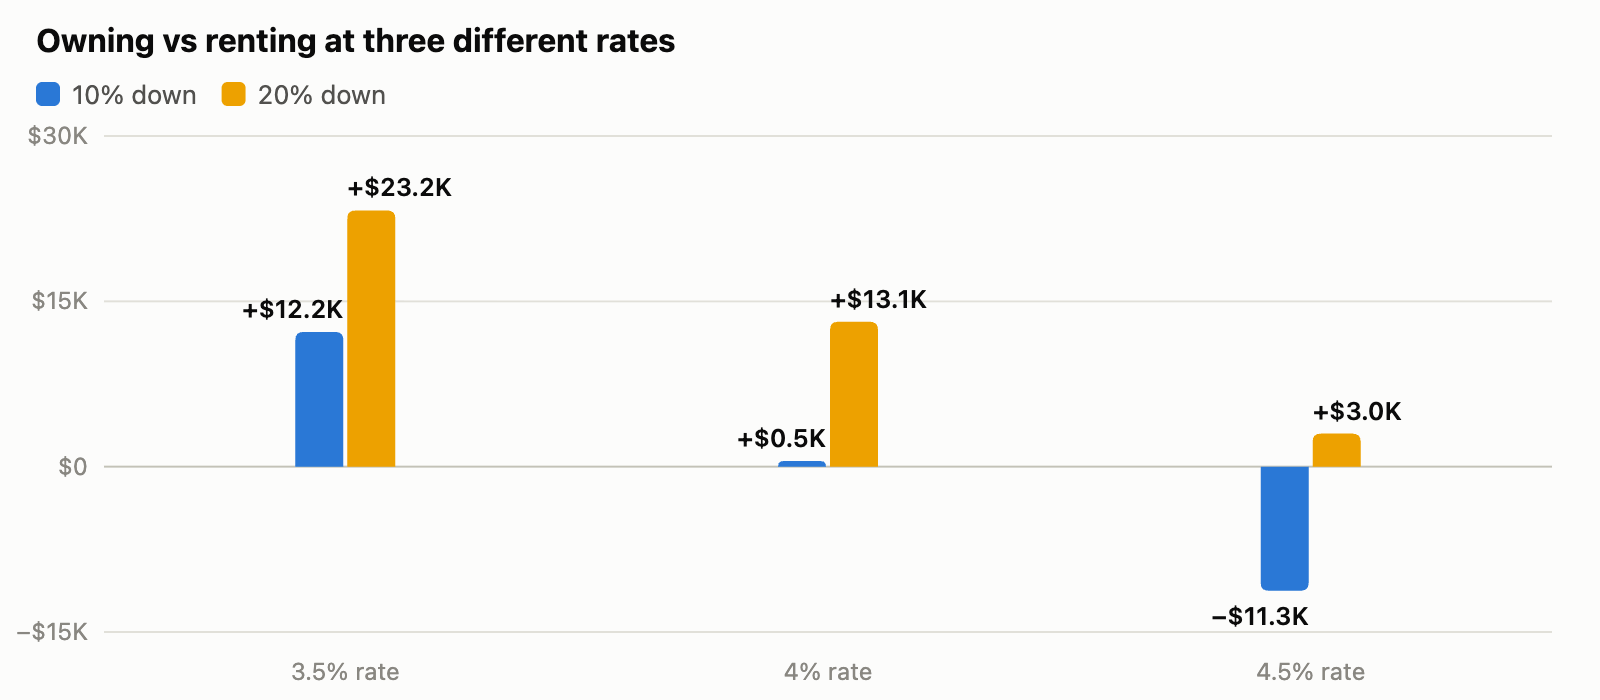
Of course, all of this hangs on the rate, so we stress tested it. At 3.5 percent, owning wins at either down payment: the owner finishes the five years about $12,200 ahead of the renter with 10 percent down, and about $23,200 ahead with 20. At 4.5 percent the coin lands the other way for the smaller down payment, and renting wins by about $11,300, while the 20 percent buyer still squeaks past renting by about $3,000. Read that again: the whole rent versus buy question in Mimico right now swings on half a point of interest and the size of the cheque you bring. This is why the mortgage pre approval conversation matters more than the listing photos.
Before anyone runs to the bank, the caveats. Getting in takes real cash: $53,065 down at 10 percent or $106,131 at 20, plus land transfer tax of about $14,176 in Toronto (first time buyers get up to $8,475 of that back) and legal fees on top. Rates change at renewal. Condo fees rise. Prices can fall as well as climb, and this very report shows them softening. And we are realtors, not financial advisors or mortgage brokers, so treat this as a starting point for a conversation, not a plan. But at 2026 prices and rents, the old assumption that renting is automatically the cheaper way to live in Humber Bay Shores does not really hold. It is closer to even than most people think.
Month | Sales | Avg sold price | Avg $/sq ft | Sale DOM (avg) | Leases | Avg rent | Lease DOM (avg) |
|---|---|---|---|---|---|---|---|
Jan 2026 | 13 | $536,423 | $804 | 44 | 67 | $2,403 | 25 |
Feb 2026 | 17 | $527,088 | $822 | 50 | 47 | $2,395 | 20 |
Mar 2026 | 22 | $537,468 | $834 | 36 | 104 | $2,399 | 23 |
Apr 2026 | 25 | $540,320 | $802 | 38 | 87 | $2,419 | 22 |
May 2026 | 14 | $532,429 | $782 | 26 | 99 | $2,453 | 20 |
Jun 2026 | 25 | $513,420 | $799 | 41 | 65 | $2,437 | 21 |
Thinking about your own unit? We live and breathe this pocket of the waterfront. If you want to know what your one bedroom would sell or lease for in today's market, reach out and we will run the numbers on your exact building, no pressure and no obligation. Get in touch, explore our neighbourhood guides, or join the newsletter.
Dave Dubbin
Etobicoke Real Estate Expert
Dave Dubbin & Associates
Real Estate Broker for Etobicoke and Toronto
Sotheby's International Realty, Canada
About the data. Source: Toronto Regional Real Estate Board MLS, one bedroom condo apartments (including one plus den) with at least one parking space in the Mimico district (Toronto W06), firm sales and leases closed January 1 to June 30, 2026. Price per square foot is calculated on the midpoint of each listing's reported square footage range. Averages are simple averages across all transactions. The renting vs buying comparison assumes the average sold price, either 10 percent down with CMHC insurance of 3.1 percent added to the mortgage or 20 percent down with no insurance, a 4 percent fixed rate compounded semi annually over a five year term with a 25 year amortization, average maintenance fees and property taxes from the sold listings, and rent held flat. It excludes utilities, insurance, closing costs, rate changes at renewal, and any change in property value, and it is general information, not financial advice. Information is deemed reliable but is not guaranteed. Not intended to solicit properties currently under contract.
Stay up to date on the latest real estate trends.
Liberty Villiage
Etobicoke Lifestyle & Community
Liberty Villiage

Buyer Advice
Buyer Advice
Market Insight

Buyer Advice
Community Feature

Market Insight

DAVE DUBBIN & ASSOCIATES
3109 BLOOR ST W #1 TORONTO ON M8X 1E2 CANADA