Etobicoke Above $2 Million: What the Top End of the Detached Market Actually Looks Like
Market Insight Dave Dubbin September 21, 2026
Market Insight Dave Dubbin September 21, 2026
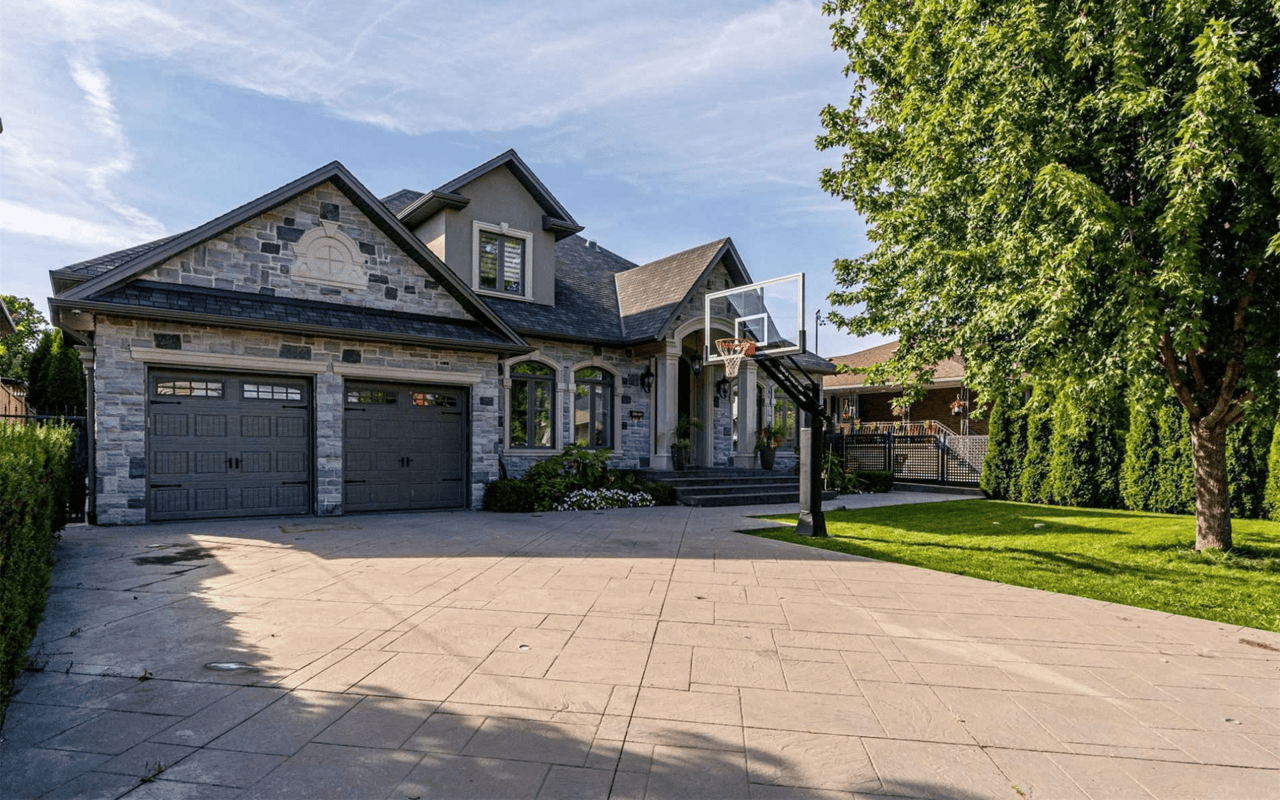
Etobicoke has a top end, and it is smaller and stranger than most people assume. In August 2026, detached homes in Toronto W07, the Stonegate and Queensway district, averaged $2,160,676, while the median came in at $1,770,000. In W08, the district holding Kingsway South, Princess-Rosethorn, Edenbridge-Humber Valley, Islington-City Centre West and Markland Wood, detached averaged $1,962,291 against a median of $1,715,000. Those two gaps, roughly $391,000 and $247,000, are the whole story of the Etobicoke luxury market in one number each. They tell you that a handful of very large sales are doing the heavy lifting, and that most of what actually trades sits well below the headline.
Wondering where your home sits in this range? Get a valuation from our team.
TRREB reports by district rather than by neighbourhood, and Etobicoke splits across five of them. Here is detached, August 2026.
District | Average | Median | Average above median |
|---|---|---|---|
W07 Stonegate, Queensway | $2,160,676 | $1,770,000 | $390,676 |
W08 Kingsway South, Princess-Rosethorn, Edenbridge-Humber Valley, Islington-City Centre West, Markland Wood | $1,962,291 | $1,715,000 | $247,291 |
W06 Mimico, New Toronto, Long Branch, Alderwood | $1,371,688 | $1,397,500 | minus $25,812 |
W09 Willowridge, Martingrove-Richview, Humber Heights | $1,094,046 | $1,070,000 | $24,046 |
W10 Rexdale-Kipling, West Humber-Clairville, Thistletown, Elms-Old Rexdale | $877,206 | $857,000 | $20,206 |
Toronto West, all districts | $1,327,593 | $1,100,000 | $227,593 |
All TRREB areas | $1,288,669 | $1,100,000 | $188,669 |
Source: TRREB Market Watch, detached transactions, August 2026.
Two ways to describe a market. The average adds every sale and divides. The median lines every sale up smallest to largest and picks the one in the middle. When the two match, sales are spread evenly. When the average sits well above the median, a few outsized sales are dragging it upward, and the middle of the market is quieter than the headline suggests. Statisticians call that a right-skewed distribution. In plain terms, a small number of big trades are distorting the picture.
W07 is the clearest case. Its average outruns its median by $390,676 on detached. That district is not uniformly a $2 million market. It contains pockets where homes trade near the river and along the older streets at levels far above what a typical Queensway bungalow fetches, and in a month with relatively few sales, three or four of those pull the whole average up.
W06 is the opposite and worth noticing. Its median of $1,397,500 sits slightly above its average of $1,371,688. That is an unusually tight, even market. Mimico, New Toronto, Long Branch and Alderwood detached stock is more consistent in size and vintage, so sales cluster instead of scattering. If you are reading comparables in W06, the average is telling you something close to the truth. In W07 and W08, it is not.
Across the entire TRREB region in August 2026, 266 homes sold at $2,000,000 or more, out of 5,057 total sales. That is 5.3 percent of the market, and that figure covers every home type, not just detached. Etobicoke holds a meaningful share of those sales, but the absolute count in any single district in any single month is small, often in the single digits.
Small sample sizes are why month-to-month swings at the top end mean much less than they appear to. If W08 posts a higher average next month, it may signal nothing more than one $5 million sale closing in September rather than August. Anyone quoting a single month of luxury data as a trend is overreading it. Look at quarters, and look at the median alongside the average.
If you are looking at Etobicoke across price points, these are worth a read:
Toronto charges municipal land transfer tax on top of the provincial one, and above $2 million the municipal side moves into higher brackets. This is the line item that surprises people moving in from outside the city, because it lands in cash on closing day and cannot be financed into the mortgage. On a $2 million purchase the combined provincial and municipal bill runs to a substantial five-figure sum, and it scales upward from there. Budget it as a real cost of entry, not an afterthought, and run your specific number before you write an offer.

Across the GTA, homes took 51 days to sell on average in August, up from 45 in July. At the top end that figure is usually longer, for a structural reason: the buyer pool shrinks as the price rises. A $900,000 Etobicoke semi has thousands of qualified buyers. A $2.8 million home on a ravine lot might have a few dozen in a given season, and several of them are not looking this month.
What that means in practice is that pricing mistakes are far more expensive up here. In a deep market, an overpriced listing gets corrected by traffic within two weeks. In a thin one, an overpriced listing sits, goes stale, and then trades below where it would have gone had it been priced to the market on day one. We see that pattern every year in Etobicoke, and it is almost always self-inflicted.
Homes that do move at the top end tend to share a few things: they are renovated to a standard that matches the price, they are priced against genuine comparables rather than against the seller's purchase price plus improvements, and they are presented properly. At $2 million and up, buyers are comparing your home to new construction and to fully finished alternatives. Half-finished work reads as a discount, and buyers apply that discount generously.
You have more leverage than buyers had three years ago, and the data supports that. New listings across the GTA fell 14.1 percent year over year in August and sales fell 2.1 percent, but the MLS Home Price Index composite is down 4.5 percent year over year, and the average price is down 2.7 percent. Prices have softened while the Bank of Canada has held its policy rate at 2.25 percent for seven consecutive decisions, most recently on September 2, 2026.
Use that leverage on terms as much as price. At this level, closing flexibility, a proper inspection period and clean conditions often matter more to a seller than the last $25,000. And get an appraisal perspective early, because financing at the top end depends on a lender agreeing with your number, not just the seller agreeing with it.
Price against the median, not the average. If your agent hands you a district average as justification for your list price, ask which specific sales produced it and whether your home resembles them. In W07 and W08 the average is inflated by a small number of trades that may have nothing in common with your property.
Then plan for a longer runway. The top end does not respond to a two-week launch the way the middle of the market does. It responds to correct pricing and sustained exposure to a small, specific buyer pool.
The case that the top end holds up: detached supply in the established Etobicoke districts is effectively fixed, since nobody is manufacturing new lots in Kingsway South or Edenbridge-Humber Valley. New listings are down sharply year over year. Scarce supply plus stable rates tends to put a floor under values, even when volume is soft.
The case that it keeps drifting: the HPI composite is down 4.5 percent year over year, the benchmark is falling faster than the average, and headline inflation sitting near 3 percent gives the Bank of Canada little reason to cut at its October 28 decision. Buyers at this level are not forced buyers. They can wait, and when they wait, thin markets soften.
What would change our read: two or three consecutive quarters where the median in W07 and W08 rises rather than the average, which would mean the broad middle of those districts is appreciating instead of a few large sales flattering the numbers. That has not happened as of September 21, 2026.
Buying or selling at the top end of the Etobicoke market? Get in touch and we will walk through the comparables that actually apply to your property.
Dave Dubbin
Etobicoke Real Estate Expert
Dave Dubbin & Associates
Real Estate Broker for Etobicoke and Toronto
Sotheby's International Realty, Canada
Stay up to date on the latest real estate trends.

Community Feature

Market Insight
Market Insight

Buyer Advice
Buyer Advice

Market Insight

Market Insight

Community Feature
Market Insight

DAVE DUBBIN & ASSOCIATES
3109 BLOOR ST W #1 TORONTO ON M8X 1E2 CANADA