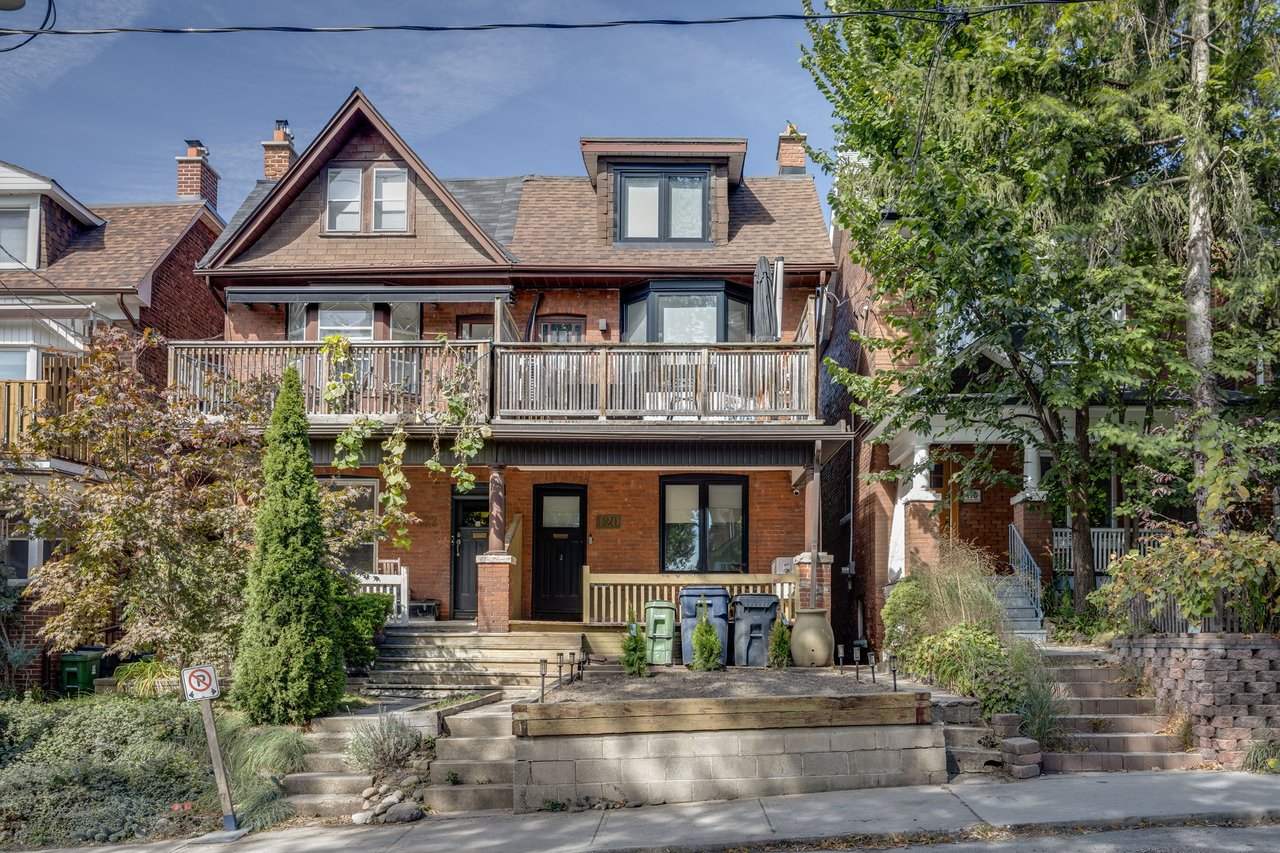
Average Price Up, Benchmark Down: How to Read August's Housing Numbers in Etobicoke
Market Insight Dave Dubbin September 18, 2026
Market Insight Dave Dubbin September 18, 2026
Canada's average home price was higher this August than it was a year ago. Canada's benchmark price was lower. Both numbers came out of the same Canadian Real Estate Association release on September 15, 2026, and both are correct. The average sale price was $668,219, up 0.6 per cent year over year. The MLS Home Price Index, which is the benchmark, was down 3.0 per cent. That is not a contradiction and it is not a typo. The two numbers measure different things, and once you know which is which you stop getting knocked around by housing headlines. The same split shows up in the Toronto numbers, and here in Etobicoke the gap between the two is telling you something specific about what has been trading.
Curious what the split means for your actual address rather than the country? Get a current valuation on your Etobicoke home and we will walk you through the comparable sales sitting behind the number.
National sales slipped 0.7 per cent from July on a seasonally adjusted basis, and came in 6.9 per cent below August 2025 on the raw count. New listings rose 3.3 per cent month over month, which reversed three straight monthly declines. CREA read that as sellers getting an early jump on the fall market, partly because Labour Day landed late this year.
The supply side is the quiet part. There were just under 200,000 properties listed across Canadian MLS systems at the end of August, roughly the historical average for that point in the year and only 1.4 per cent above last year. Months of inventory sat at 4.8, unchanged for a fourth straight month, against a long run average of five. CREA puts a seller's market below 3.6 months and a buyer's market above 6.4. So nationally, we are sitting almost exactly in the middle of the range, and we have been for most of the summer.
CREA's economists also flagged something worth reading twice. Fixed mortgage rates have already climbed on higher bond yields, and on the variable side a rate hike is back on the table for this year and already priced into markets. That is a real change in tone from where the conversation was in the spring.
The average sale price is arithmetic. Add up every sale, divide by the number of sales. It tells you what the typical dollar amount of a transaction was last month, and it moves whenever the mix of what sold changes. Sell more detached homes and fewer condos and the average rises, even if every single home sold for exactly what it would have fetched a year earlier.
The MLS Home Price Index is built to strip that out. It tracks a constant quality benchmark home, holding the attributes steady, so that what you are watching is price movement rather than composition. Economists call the difference a mix shift or a composition effect, and the plain version is this: the average tells you what sold, the benchmark tells you what it is worth.
When the two diverge, the divergence itself is the signal. An average rising while a benchmark falls almost always means the expensive end of the market is doing a larger share of the trading. That is exactly what has been happening across Canada in 2026, and it matters more in a place like Etobicoke than in a market with a narrow spread of housing types, because our spread is enormous. A one bedroom at Humber Bay Shores and a detached home off Royal York are both Etobicoke sales, and they are separated by well over a million dollars.
Here is the clearest way to see it. Imagine a neighbourhood where ten homes sell in each of two months. Condos go for $600,000 and detached homes go for $1,400,000. Nobody raises a price, nobody cuts one. The only thing that changes is the mix.
| Month one | Month two |
|---|---|---|
Condos sold, at $600,000 each | 6 | 4 |
Detached sold, at $1,400,000 each | 4 | 6 |
Total dollar volume | $9,200,000 | $10,800,000 |
Average sale price | $920,000 | $1,080,000 |
Benchmark price, either type | Unchanged | Unchanged |
Illustrative example built by Dave Dubbin & Associates to show how composition moves an average. Not market data.
The average jumped 17.4 per cent. Not one home changed price. Anyone reading the headline would conclude the neighbourhood had a monster month, and they would be wrong. This is why we never quote a client an average as if it were a valuation, and why the benchmark is the number we actually watch when we are trying to figure out where a segment is heading.
If you are working through where your own segment sits, these three go deeper:
Locally, both measures are negative, but they are not negative by the same amount. TRREB reported 5,057 GTA sales in August 2026, down 2.1 per cent year over year, on 12,075 new listings, down 14.1 per cent. The average selling price was $993,410, down 2.7 per cent. The MLS HPI Composite benchmark was down 4.5 per cent.
Break the GTA down by type and the story sharpens. Detached averaged $1,288,669, down 1.8 per cent. Semis were $931,665, down 4.9 per cent. Freehold townhouses were $882,060, down 6.8 per cent. Condo apartments were $617,593, down 3.8 per cent. Detached is the segment holding up best and it is also the segment with the biggest dollar figures, which is precisely the ingredient that props up an average.
One more comparison, with a caveat attached. CREA's national sales to new listings ratio was 49.1 per cent in August on a seasonally adjusted basis, easing from 51.1 per cent in July against a long run average of 54.7. Run TRREB's reported August counts through the same arithmetic and the GTA lands near 42 per cent. Those two are not measured identically, since the TRREB figure here is our own calculation from actual counts rather than a seasonally adjusted series, so treat it as directional rather than precise. The direction is still worth knowing. Even with new listings down sharply, buyers in this market are absorbing a smaller share of what comes up than the country as a whole.
Three practical things.
First, if someone tells you Canadian home prices went up in August, they are quoting the average and they are describing a mix, not your house. The benchmark fell nationally and it fell harder in the GTA. Plan around the benchmark.
Second, this is a segmented market, and segmentation is not a detail. Detached in Sunnylea, a Queensway townhouse and a one bedroom on Marine Parade are three different markets that happen to share a postal prefix. The GTA composite is an average of all of them, which means it describes none of them well. When we price a listing we start from the segment, not the headline.
Third, the thin volume cuts both ways. Fewer sales means fewer comparables, and fewer comparables means noisier price discovery, which is the process by which a market figures out what something is worth. In a thin segment a single unusual sale can drag the local average around for a month. That is an argument for patience on both sides of a deal, and an argument against reading too much into any one number.
The obvious one is rates. If bond yields keep pushing fixed rates up and the Bank of Canada follows with a hike at the October 28 or December 9 decision, the payment math moves against buyers and the benchmark has further to fall. The policy rate has been at 2.25 per cent since the September 2 hold. Inflation came in at 3.0 per cent in August, released September 14, with gasoline up 22.8 per cent doing most of the lifting and everything else running at 2.4 per cent. That distinction is what the Bank will be arguing about internally.
The other direction is supply. TRREB's new listings were down 14.1 per cent year over year in August, and if inventory keeps tightening while sales hold flat, competition returns and the benchmark stops falling. TRREB made that argument in its own August release. We would want to see two or three months of it before we believed it, because a single tight month in a flat market is usually seasonality rather than a turn.
The version of this we would be wrong about is the one where the national average keeps climbing for reasons that have nothing to do with Toronto. Alberta and Atlantic Canada have been carrying a lot of the country's price strength. If that continues, the national headline will get further and further from anything recognizable on this side of the Humber, and reading the two as one market will cost you.
If you are deciding between listing this fall and waiting for spring, that is a question about your segment and your timeline, not about the national average. Book a call and we will pull the actual comparable sales for your block, show you what the benchmark has done in your specific type, and tell you plainly if we think waiting is the better play. Sometimes it is. Get in touch here.
Dave Dubbin
Etobicoke Real Estate Expert
Dave Dubbin & Associates
Real Estate Broker for Etobicoke and Toronto
Sotheby's International Realty, Canada
Stay up to date on the latest real estate trends.
Liberty Villiage
Etobicoke Lifestyle & Community
Liberty Villiage

Buyer Advice
Buyer Advice
Market Insight

Buyer Advice

Community Feature

Market Insight

DAVE DUBBIN & ASSOCIATES
3109 BLOOR ST W #1 TORONTO ON M8X 1E2 CANADA